ASD Traits Analysis leveraging
Autistic Spectrum Disorder Screening Data for Toddlers
Addressing the urgent global increase in Autism Spectrum Disorder (ASD), this initiative proposes a new, behavior-focused dataset aimed at enhancing early ASD screening and diagnosis through efficient and accessible methods.
In this dataset, we record ten behavioural features (Q-Chat-10) plus other individuals characteristics that have proved to be effective in detecting the ASD cases from controls in behaviour science.
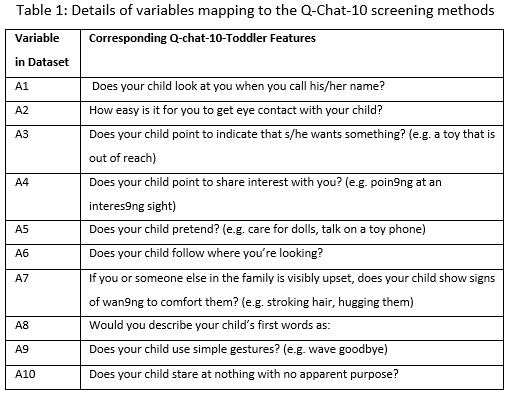
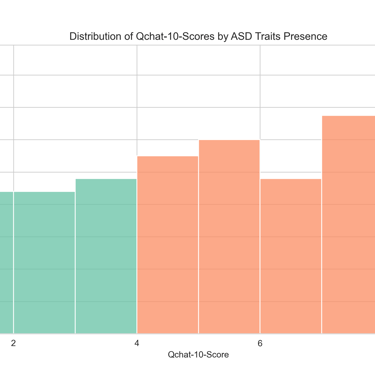
Dr. Fayez Thabtah collected asked parents of 1054 toddlers of age less than three years old 10 Yes/No behavioural questions. The number of "Yes" were added up and have been recorded in the column called "Q chat 10 question". If this column has more than 3 "Yes", toddlers will be classified as positive ASD
1) Tabtah, F. (2017). Autism Spectrum Disorder Screening: Machine Learning Adaptation and DSM-5 Fulfillment. Proceedings of the 1st International Conference on Medical and Health Informatics 2017, pp.1-6. Taichung City, Taiwan, ACM.
2) Thabtah, F. (2017). ASDTests. A mobile app for ASD screening. www.asdtests.com [accessed December 20th, 2017].
3) Thabtah, F. (2017). Machine Learning in Autistic Spectrum Disorder Behavioural Research: A Review. Informatics for Health and Social Care Journal.
4) Thabtah F, Kamalov F., Rajab K (2018) A new computational intelligence approach to detect autistic features for autism screening. International Journal of Medical Infromatics, Volume 117, pp. 112-124.
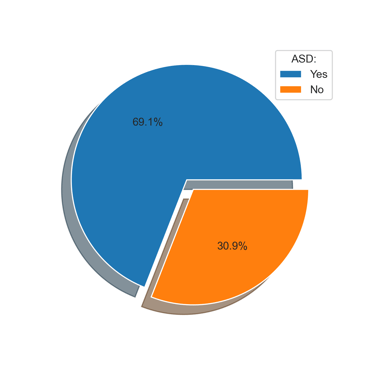
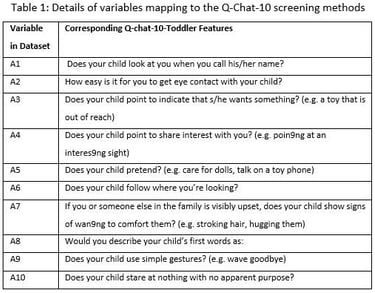
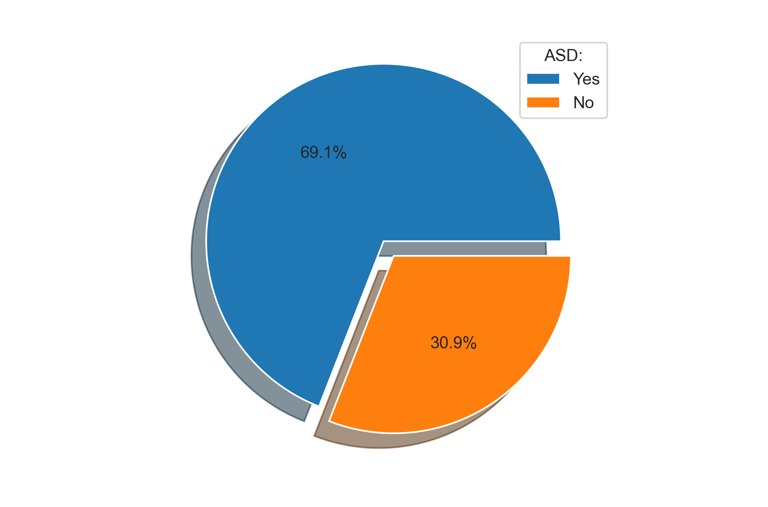
This script takes data about toddlers and checks how many of them show traits associated with autism. It creates a pie chart to visually represent the percentage of toddlers with and without these traits. One section of the pie chart is highlighted to make the distinction clearer, and the chart is labeled so you can easily see the difference between the two groups.
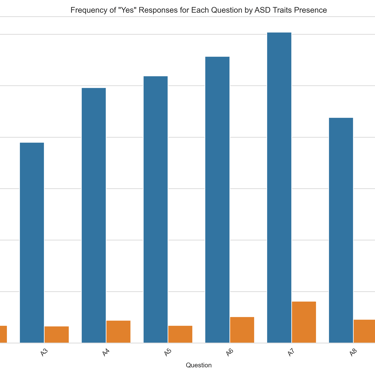
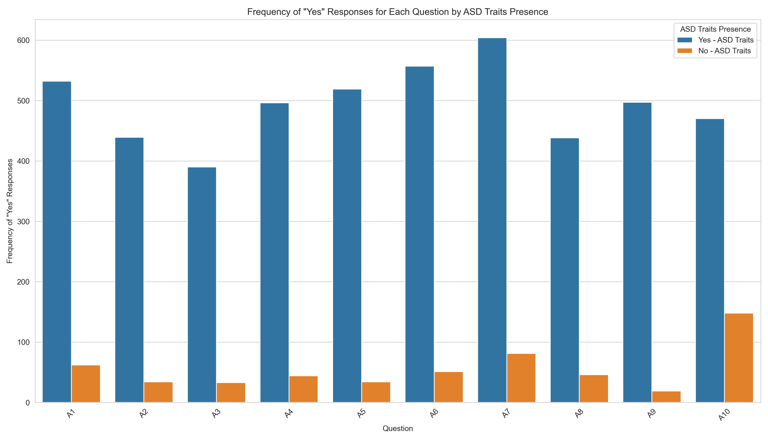
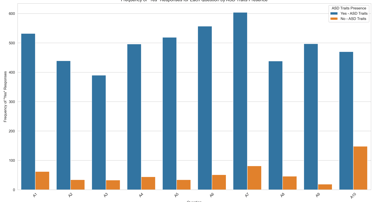
This script analyzes a set of questions answered by parents or caregivers based on their observations of toddlers' behavior. For each question, it compares how often behaviors associated with autism traits were observed ("Yes" responses) between toddlers who show autism traits and those who do not. It then creates a bar chart to visually represent the differences in these responses, helping to identify any patterns in behavior between the two groups.
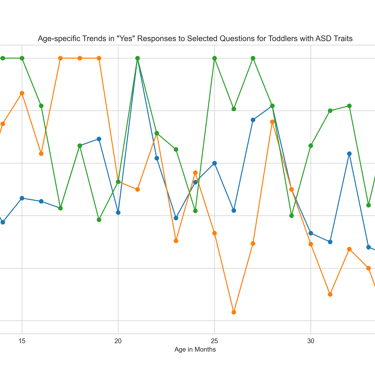
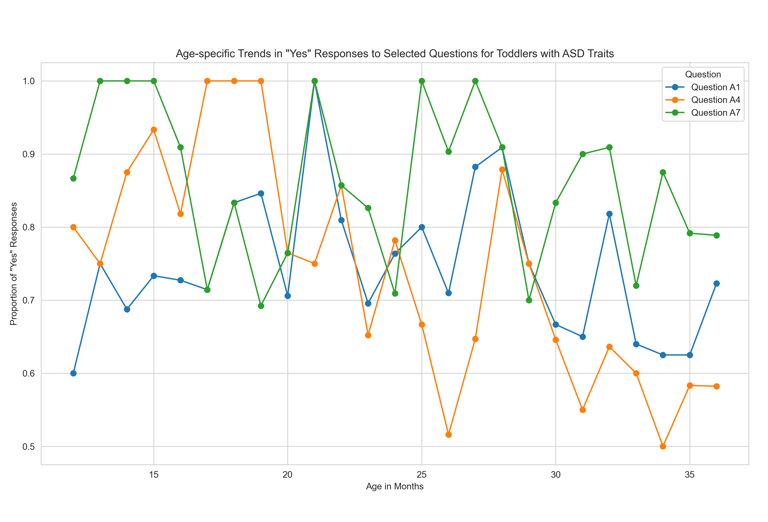
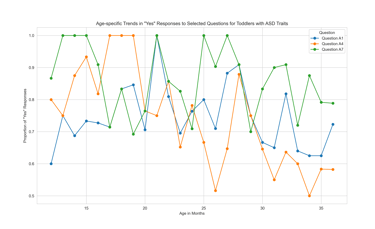
This script looks at how toddlers with autism traits show certain behaviors over time as they grow. By focusing on specific questions, it analyzes how often these behaviors are observed at different ages in months. The results are displayed in a line chart that shows how the frequency of "Yes" responses to these questions changes as toddlers get older, helping to identify age-related trends in behaviors associated with autism traits.
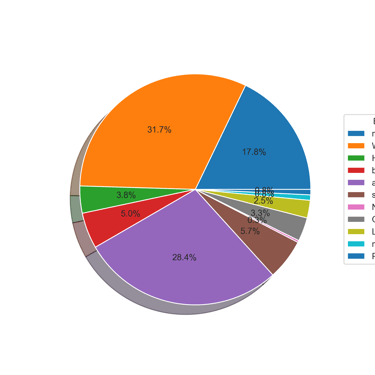
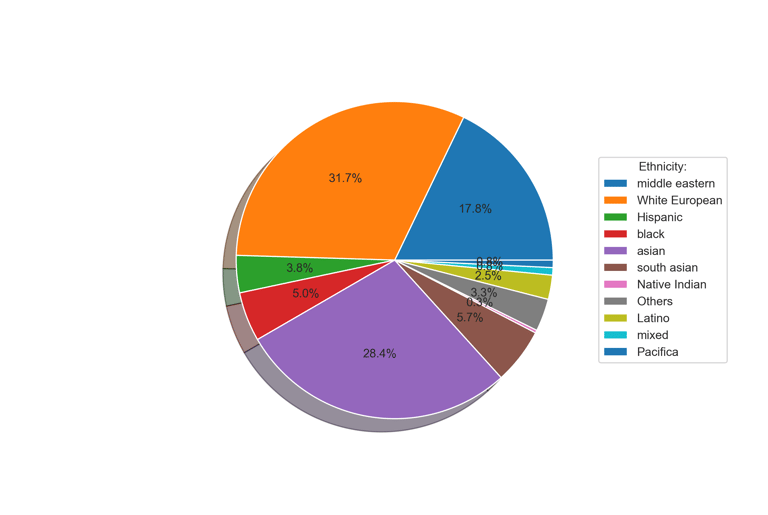
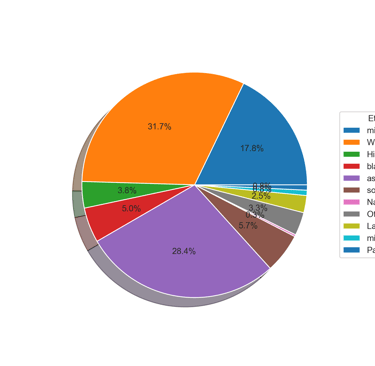
This script creates a pie chart to show the ethnic breakdown of toddlers in the dataset. It displays the percentage of toddlers from different ethnic groups, providing a visual representation of the diversity within the data. The chart includes a legend to label each group and helps to easily see how each ethnicity is represented.